BLAT (preferred): from UCSC website (http://genome.ucsc.edu/), save the result page as “.htm/.html” file, or ENSEMBL website (http://www.ensembl.org/Multi/blastview), save the “raw results” for each query in a directory as “.txt” file.
BLAST (not fully functional, see below): from local install with the "-m 7" option that create a XML ouput file, or NCBI website (http://blast.ncbi.nlm.nih.gov), save as “.xml” file.
!!! CAUTION: BLAST give the position of each HSP on the subject contig, not chromosome. In addition, the “Length threshold” can't be used to filter HSPs.
Open NumericalFISH with the command "python NumericalFISHgui.py"
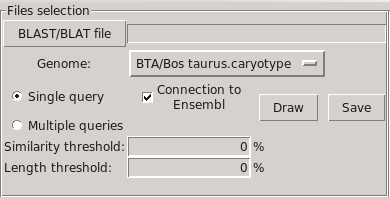
Select a BLAT or BLAST file, then a specie in those available.
Select the visualization mode, "Single query" or "Multiple query" (see below).
Click the "Draw" button to get the graphical view with the whole caryotype.
The image can be saved through the "Save" button, as PNG, JPEG, BMP or PS.
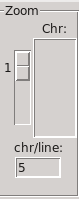
The chromosomes placement can be modified by changing the number of chromosome per line.
The zoom level can be changed by selecting a level of zoom from 1 to 5, or by selecting a chromosome number, or by double-clicking on a chromosome.

The chromosomes of selected specie are placed according to the "number of chromosomes per line" option. The sequences spotted by BLAT or BLAST are represented by a segment on one side of the corresponding chromosome, according to its position on it: on the left side and in blue for a "sens" sequence, on the right side and in red for a "antisens" sequence.
They are two ways to display the Numerical FISH:
- "Single query" shows on y axes the position of the sequence. If multiple sequences stand on the same locus, they are represented side by side.
- "Multiple queries" shows on y axis the position, and divide the x axis in as much columns as queries submitted to BLAT or BLAST. Each sequence is then placed at its position, and in the column corresponding to the query.
- "Similarity threshold" is the minimum percentage of similarity required to display a sequence.
- "Length threshold" is the minimum length required to display a sequence.
Informations about each sequence is displayed in the "sequence info" frame when the mouse fly over it.
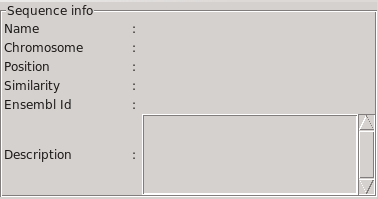
Here is displayed, if the box “connection to Ensembl” is checked:
- the name of the query sequence, as provided to BLAT or BLAST.
- the name of the chromosome, and the position on it.
- the Ensembl Id, if exists, of the gene surrounding the position
of the sequence, and its description.